TL;DR
- Finding keyword data on the URL level with Google Analytics data isnt easy.
- This free template will help you make a dynamic report to show you what keywords are responsible for your KPIs.
- Americaneagle.com is hiring!
- Sign up for the #SEOFOMO Newsletter
Keywords fuel SEO, but they really should fuel all marketing materials and messages. In recent years it has become more and more difficult to associate keywords with on-page data. Almost all keyword data in Google Analytics comes up as (not provided) which helps no one, so maybe just get rid of that table. The Search Console section in GA provides some insight, but it is still difficult to show key metrics, especially for e-commerce sites.
This led me down a path to use Google Data Studio to bring in data from both Google Search Console & Google Analytics to show what queries are resulting in actions on-site.
Free Google Data Studio Template
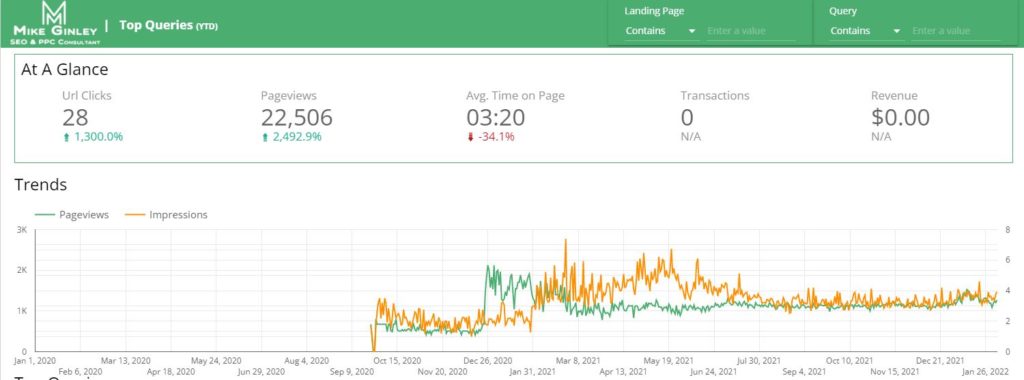
Google Data Studio has been one of the most helpful tools since I started in digital marketing. It allows anyone to bring in data from numerous sources with lots of customization. The best part is that it is dynamic so it takes a lot of time out of reporting. This free Google Data Studio Template will allow you to combine your Google Analytics Data and Google Search Console data matched on the URL level. You can then associate it with any other metrics from the tools you find useful as KPIs. There is also a query feature at the top that can help you with content creation and optimization.
Looking to improve on a keyword ranking? Search the term here and see how the page is performing for that query. Is the time on page low? Maybe it needs some more focused content, or the layout needs to be updated. There is a lot that can come from this, but knowing what query is triggering certain actions on a page is huge!
Steps for Google Data Studio Template
Step 1 – Visit this report and click the copy icon in the top right.
There will be a popup to choose the sources, I recommend just hitting the copy report with default features as we will be manipulating the sources in the next step. Then we will blend them together.
Step 2 – Add Google Analytics & Google Search Console URL View
To do this, click Resources in the navigation, then choose Manage Added Data Sources.
Choose your correct Google Analytics View and Google Search Console URL Impression, not site.
Step 3 – Manipulate Google Analytics View
Similar to the steps above, go back and select Manage Added Data Sources. Then hit Edit like the below image to pull up the Google Analytics Connection.
In the top right select Add A Field.
Then we will create a new field named Full URL like below.
The formula that will help combine GA & GSC data is CONCAT(“https://www.yoursite.com”,Landing Page)
Hit Done in the top right to save the new field.
Step 4 – Blend Data
Now we have the two sources set up and a way to join them. Go back to Resource in the main nav and select Manage Blended Data.
Select Add A Data View.
For the first Data Source select your Google Search Console URL View. For the second select your Google Analytics View.
Now for the join keys or how Google Data Studio blends this data, select Landing Page for GSC and Full URL for GA. Before we manipulated the GA source above with the custom field, Data Studio would not accept these join keys because they did not match.
If both the join keys are green then you are good to go! If there is an issue it may be coming from a capitalization mismatch in GA. You can use the CASE – Data Studio Help guides to sort through these issues to match the URLs in the custom field section.
You can then select Query & Full URL as the respective dimensions to report on. Then you can choose any metrics you consider to be KPIs. For this report, I chose the main GSC metrics along with common on-page data from GA. I added in transactions and revenue in this example just to show how it works, there is no data because my site has no e-commerce functionality.
When you have all the metrics selected, name the Blended Data in the top right GA & GSC. Now hit save and go back to the dashboard.
Step 5 – Update Chart Data Source
Now you can hold shift + click on all the charts and choose the GA & GSC Data Source in the right nav. This should populate all the charts with the blended data from Google Analytics and Google Search Console.
You may need to create an additional field I like to report on Missed Clicks. To do that just click on that scorecard and in the right nav, choose the broken metric, then choose Create Field. The formula will be Impressions – URL Clicks.
I like to report on this metric to show what is trending with our target audience. We’re not always going to get every click, but this can help fuel strategic decisions on keywords to use in other channels like email and PPC. If we’re not going to get the click from organic, let’s try and get it elsewhere. These are the exact terms our audience is using and looking for, so let’s keep them in front of them.
After that, you can add different charts/scorecards for whatever fits your KPI reporting.
How To Use This?
For the timing of this report, you can choose whatever suits you. I have it set to stretch back to Jan. 1, 2020, and dynamically update each day. This way you will always be getting fresh accurate data anytime you need it.
Maybe you are looking to write a blog and looking for additional terms related to the primary. Throw the primary keyword in the search in the top right of the report and see what pops up. All the metrics of the report will change based on that query’s data. Is it driving traffic or KPIs? If so which keywords are doing that? Make sure to use those in your marketing materials.
SEO is a methodology. Use it in everything you do. This data should be used for all marketing messaging whether it’s SEO, PPC, Email or Social. Whoever is working on these channels can easily come to this dashboard and query the subject they are focused on. What keyword and page are driving traffic and conversion? Keep pushing those!