Proper keyword reporting is a moving target. There are so many ways to go about it and you can never be sure if you are focusing on the best keywords. Should you segment brand vs. non-brand? Should you look at winning keywords vs. target? It all depends on your business goals and KPIs. Regardless of that, I created a simple semi-automated Google Data Studio template using Culver’s that can hopefully help anyone simplify their keyword reporting.
I say semi-automated because it requires some manual copy and pasting into a Google Sheet, but that’s it! There are ways to fully automate this, but those require more time and possibly money and not everyone has those available. I definitely recommend looking into more automation of reporting. Google Data Studio is a game-changer when connecting Google Analytics, Google Search Console and more. It is so nice to be able to customize the metrics you want to see on a daily basis in the format you want. Save time and stress by quickly getting the insights you want.
Grab some cheese curds from Culver’s and let’s get started setting up your Keyword Reporting Google Data Studio Template.
Step 1: Copy The Free Template
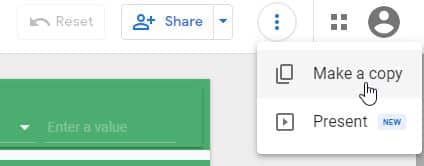
Visit this Google Data Studio link and in the top right hit the three verticle dots and then ‘Make A Copy’.
You can ignore the new Data Sources for now, we will set those up next. Just hit the blue ‘Copy Report’ button. It will then set up your report with ‘Copy Of’ in the title and all the data will break temporarily except for the keyword’s trend image.
Step 2: Setup Google Sheet Data Source & Add Keywords
Now we will want to create a fresh Google Sheet to add our keywords into. You can either set up your own or make a copy of mine.
I utilize SEMrush for my keyword reporting so they will have labels specific to their style of reports. If you use another tool you will need to make sure to change the names of the first row. In this example I am looking to report on:
- Keyword
- Position
- Search Volume
- URL
- Traffic Estimate (%)
I remove all the other fields from my SEMrush export, but you can keep them if you want, you will just need to add the fields in Data Studio after we connect the source.
When you have your Google Sheets set up, all you need to do is export your keywords from whatever tool you utilize. Make sure the first row has the labels so Google Data Studio can pick those up.
Step 3: Connect Google Sheets & Google Data Studio
When your Google Sheet data source is ready to go, we can connect it to Google Data Studio so the metrics can start flowing in.
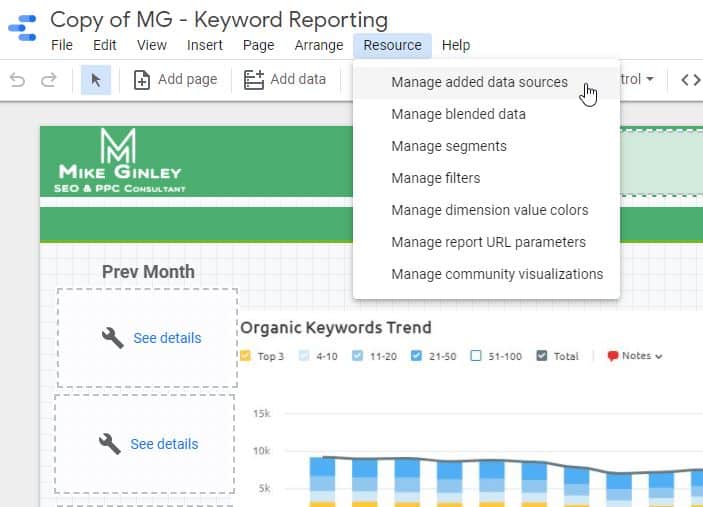
In the top nav, go under ‘Resource’ then click on ‘Manage Added Data Sources’.
You will see the old data sources are still there because we did not change them when we originally made a copy of the report. If your data source is ready when making a copy of the report you can always do this step then.
In this example, we will click ‘Add A Data Source’ below the 3 listed and we will connect the Google Sheet we just created with our keyword data.
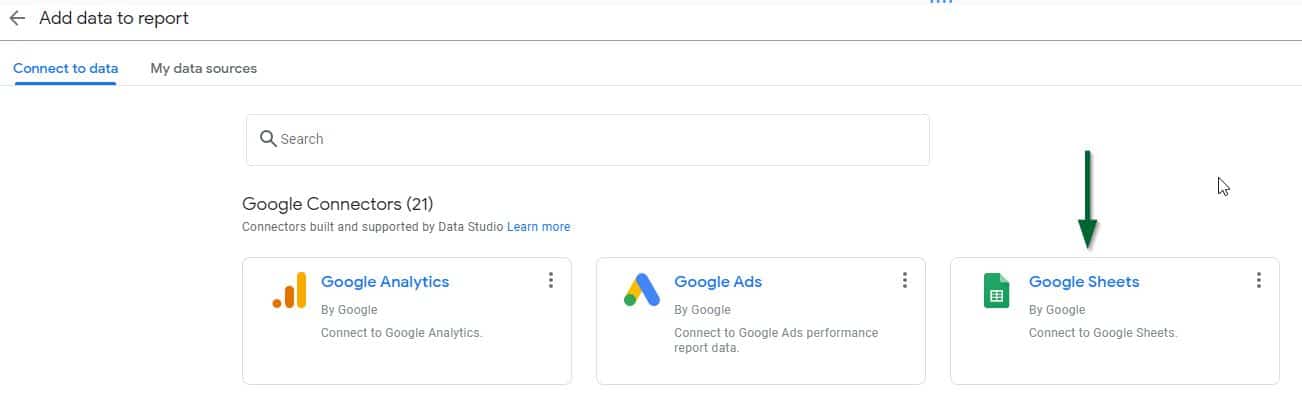
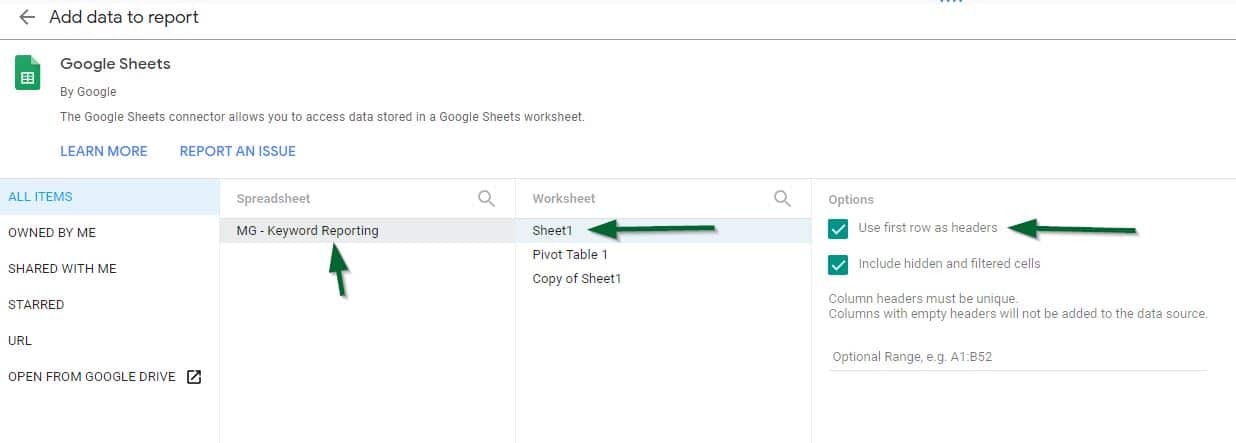
Click on the Google Sheets Connector and then authorize Google Data Studio if needed. From there:
- Select the proper spreadsheet we just created.
- Click the proper worksheet (you should only have one, ill explain the rest towards the end).
- Ensure the ‘Use First Row as Headers’ is active.
- Hit the blue ‘Add’ button in the bottom right.
Your Google Sheets and Google Data Studio should now be connected.
Step 4: Update the Reports Data Source.
Now that we added the proper data source we can go back into the ‘Resource’ section in the nav and click the ‘Manage Added Data Sources’.
We can remove the three original sources, you can tell which ones are active by the ‘Used In Report’ column. The new sheet we added shows 0 active charts. Ignore my sheet naming, you can and should be more organized than I am with these.
When we delete the original sources we can then go into ‘Page’ in the navigation to change the entire report data source under ‘Current Page Settings’.
Select the sheet we just connected (should be the only remaining data source).
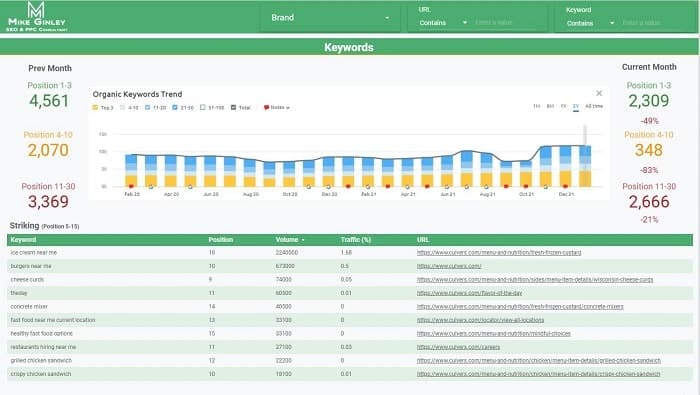
This will now populate all the information from the sheet in an organized template. You have the current month broken down on the right with positions 1-3, 4-10, and 11-30. Then the tables below are for ‘Winning’ and ‘Striking’ keywords which are positions 1-4 and 5-15 respectively. Both are sorted by the largest search volume.
These are how I like to break out my keywords so I know what we should be targeting and what we are doing well in. You can also filter above by searching by keyword or URL to see how certain terms or pages are ranking (more on that below).
Optional Step 5: Add Brand Filter and Previous Month Data
I also really like to segment out brand vs. non-brand and Google Data Studio has a great way to do that. I cover how to do that in this tweet as well as in this post about Google Data Studio Drop-Down Filters, but essentially you need to create a custom field in the data source and have that drop-down selection set as the ‘Brand’ field. For this example of Culver’s, the ‘INSERT BRAND NAME’ should be changed to ‘cul’ (no quotes). I use just a portion of the brand name as a catch-all for misspellings.
CASE
WHEN REGEXP_MATCH(Query, “(?i).*INSERT BRAND NAME.*”)THEN “Brand”
Else “Non-Brand”
One other final tweak you could make to this report is tracking the previous month’s data for keywords. To do that you just need to create another sheet with the previous month’s data and follow the same steps above to connect it, then change the data sources for the 3 fields on the left under ‘Prev Month’. It’s really helpful to get a quick glimpse of any progress you may be having with your keywords.
I also took it a step further by comparing the previous month and the current month in Google Sheets by creating a pivot table that calculates the number of keywords per position. This allowed me to create a field that calculates the percent change month over month. If you create a sheet for the previous month’s data, you will just need to update the range of the pivot table and then add that sheet as another source for the three fields below the ‘Current Month’ numbers. The formulas are already set up in the example sheet. I tried to do this in just Data Studio, but it was getting too complicated so I used Google Sheets as a workaround.
How To Use This Report
As I mentioned this is a semi-automated report, there is some manual intervention needed each month or every couple of weeks depending on your reporting cadence. The only manual things you need to do are:
- Move the previous month’s keywords over to the previous month’s sheet.
- Export keywords, and paste them into the current month’s sheet.
- Update pivot table range.
- Change the image for the keyword position trend.
That’s it!
When you do those 4 steps you have a very streamlined report to break down how your keywords are doing as well as get insight into the keywords you should be targeting (striking). You can:
- filter for brand vs. non-brand.
- find any queries containing a certain term and their corresponding ranking URLs.
- find any URLs containing a certain term and their corresponding keywords.
- Track progress month over month.
- Lots more can be added here depending on your goals!
There are lots of ways to fully automate these, but like I mentioned not everyone has the time or budget to do these. Hopefully, this can serve as a free and easy way to get some simplified reporting.